
2026 Macro Outlook: Avoiding Errors
With the Holiday season upon us, it’s time for our economic outlook for the next calendar year. In keeping with our usual practice, we find it most insightful to identify and debunk prevailing market narratives to shape our views for 2026.
(Published November 26, 2025)
--
“Perhaps the history of the errors of mankind, all things considered, is more valuable and interesting than that of their discoveries.” - Benjamin Franklin
“A very popular error: having the courage of one’s convictions; rather, it is a matter of having the courage for an attack on one’s convictions.” - Friedrich Nietzsche
“In God we trust. All others must bring data.” - W. Edward Deming
As the Holidays approach, one question dominates discussions: “What is your outlook for next year?”
The timing this year is especially tricky, given that the U.S. federal government shutdown stalled or precluded the release of key economic data.
Here’s the thing, though: we never have a complete set of data to paint a perfect picture of the economy, where it’s headed, and how best to position our portfolios. Investors always face an uncertain future.
So how can we invest?
Many investors use various stories, or narratives, to justify forecasts and portfolio bets. One exercise we’ve found helpful is to try to expose errors in such views. This task involves listening, reading, thinking, and analyzing empirical evidence for various narratives that captivate the market. It’s less about “forecasting” and more about debunking.
If we can chip away at your confidence in just a few of these popular narratives, we might help you avoid errors that hurt your portfolio. Indeed, one of the key reasons experts miss the future is that misconceptions cloud their thinking in the present.
Spotting the narratives to focus on is not always easy. Some narratives may be correct. To spot the weaker or more vulnerable narratives, there are a few telltale signs.
Narratives tend to suddenly dominate client and colleague discussions, which also serves as a gauge of how “infectious” they might be. Until recently, all talk was about tariffs; now it’s non-stop A.I. But we don’t want to beat up on “strawmen,” so the narratives outlined in our piece are based on actual conversations.
Weak narratives are also often presented like articles of faith rather than coolly reasoned hypotheses (“everyone knows that…”), or derived from a grand, sweeping story about “how the world works, ” and include a lot of “they” in the descriptions (e.g., “they don’t want the long end to spiral,” “they want to boost the equity market”).
By listening and interacting with investors, we get a sense for the narratives they tell. Now, some of these narratives might be right, but the only way to tell is to try to punch holes in them. By eliminating narratives—or at least reducing confidence in one—we aim to reduce errors in our thinking and our portfolios.
Here’s our collection of the top narratives as we head into the Holiday Season and 2026, and our brief debunking of each.
Use the links below to navigate directly to a narrative or scroll to view them in order.
The 43-day government shutdown has delayed the release of key economic data. But as mentioned above, we never have a perfect picture. In our view, there’s plenty of data that suggests the labor market is clearly slowing and, in turn, the fed funds rate should still move lower.
First, the unemployment rate has continued to move higher in September, reaching 4.4%, a cycle high.
Second, although the three-month average pace of job growth recovered from 29k in August to 62k in September, the direction of recent revisions suggests that there’s still a risk that job growth has dipped into negative territory.
Third, more high-frequency private-sector data, such as ADP's private-sector job growth (now released weekly) and monthly Challenger layoffs, indicate that the labor market has continued to weaken.
Finally, watching unemployment insurance filings remains the timeliest labor-market tracker. The number of states that experience above-trend increases in jobless claims is usually a good indicator of a recession (see Figure 1). More recently, continuing claims have reached a new cycle high, suggesting further upward pressure on the unemployment rate (see Figure 2).
Number Of States With Accelerating Unemployment Claims* Versus The Unemployment Rate

*When the three-month average continuing jobless claims to labor force ratio rises 0.2 percentage points above its 12-month low
Continuing Jobless Claims Versus Unemployment Rate

Estimates of Q3 2025 GDP suggest the U.S. grew at a 4% annual rate. But the “jobless recovery” period from 2002 to 2003 shows that the Fed can still cut rates even amid solid GDP growth.
By January 2003, the economy was a full year removed from the previous recession, and the GDP reports in real-time suggested the economy was growing at around a 2% annualized rate.1 However, nonfarm payroll employment growth remained negative until August 2003. In response to mixed signals, the Fed repeatedly cited "disappointing" production and employment readings in its press conference statements. Even though GDP prints were healthy, the Fed kept monetary policy accommodative to support the economy amid ongoing data uncertainties. In the end, the Fed eventually reduced the fed funds rate to 1% by June 2003 in the hope that “a slightly more expansive monetary policy would add further support for an economy which it expects to improve over time.”2
With today’s fed funds rate still well within restrictive territory, a strong GDP print should be one of the last data points that would prevent the Fed from moving to a neutral or even accommodative policy setting, provided that job growth remains weak.
Indeed, historically, we’ve rarely seen nonfarm payroll employment slow to such a weak pace outside a recession. Only in the 1960s did we observe nonfarm payroll employment growth slow below 100k per month but pick back up without a recession. Further, when nonfarm payroll growth slows, but GDP remains positive, growth eventually follows employment growth and slumps.
But is it possible that job growth could pick up from today’s pace? Yes, the 2002 to 2003 jobless recovery period discussed above makes the case: while nonfarm payroll employment was negative the majority of the period, GDP remained in positive territory and expanded at or above the 2% trend.3 Eventually, job growth picked up, and GDP growth accelerated further.
Today, we’ve seen weak payroll growth for at least 4 months without a GDP slump. If the rise in tech spending eventually translates into higher business profits and expanded hiring, there is a case for job growth to pick back up and stabilize in 2026. That said, if job growth remains weak or negative for an extended period, we’d be more worried that GDP growth may eventually follow.
Most investors associate solid GDP growth with accelerating inflation. However, such narratives misunderstand how the supply and demand of goods and services impact real economic growth and inflation.
In general, inflation tends to accelerate due to a shortage of goods and services supply and/or a spike in demand. A combination of both resulted in the spike in inflation after the pandemic. However, such a “sticky inflation” or “re-acceleration scenario” has occurred in only 8% of the quarters in modern U.S. history, making it even less likely than a recession!
In contrast, inflation can decelerate if there’s an abundance of supply and/or a demand reduction. Over the last two years, both an increase in the supply of goods (as supply chains recovered) and a cooldown in consumer spending (demand) have helped disinflation progress. Further, during a productivity boom, rising labor productivity will increase output and supply, making goods and services cheaper while demand remains stable. As a result, inflation can still moderate as output growth accelerates. In fact, since 1993, one-third of quarters have seen the economy grow at a 2.5% year-over-year rate or higher while core inflation remained below 2%.
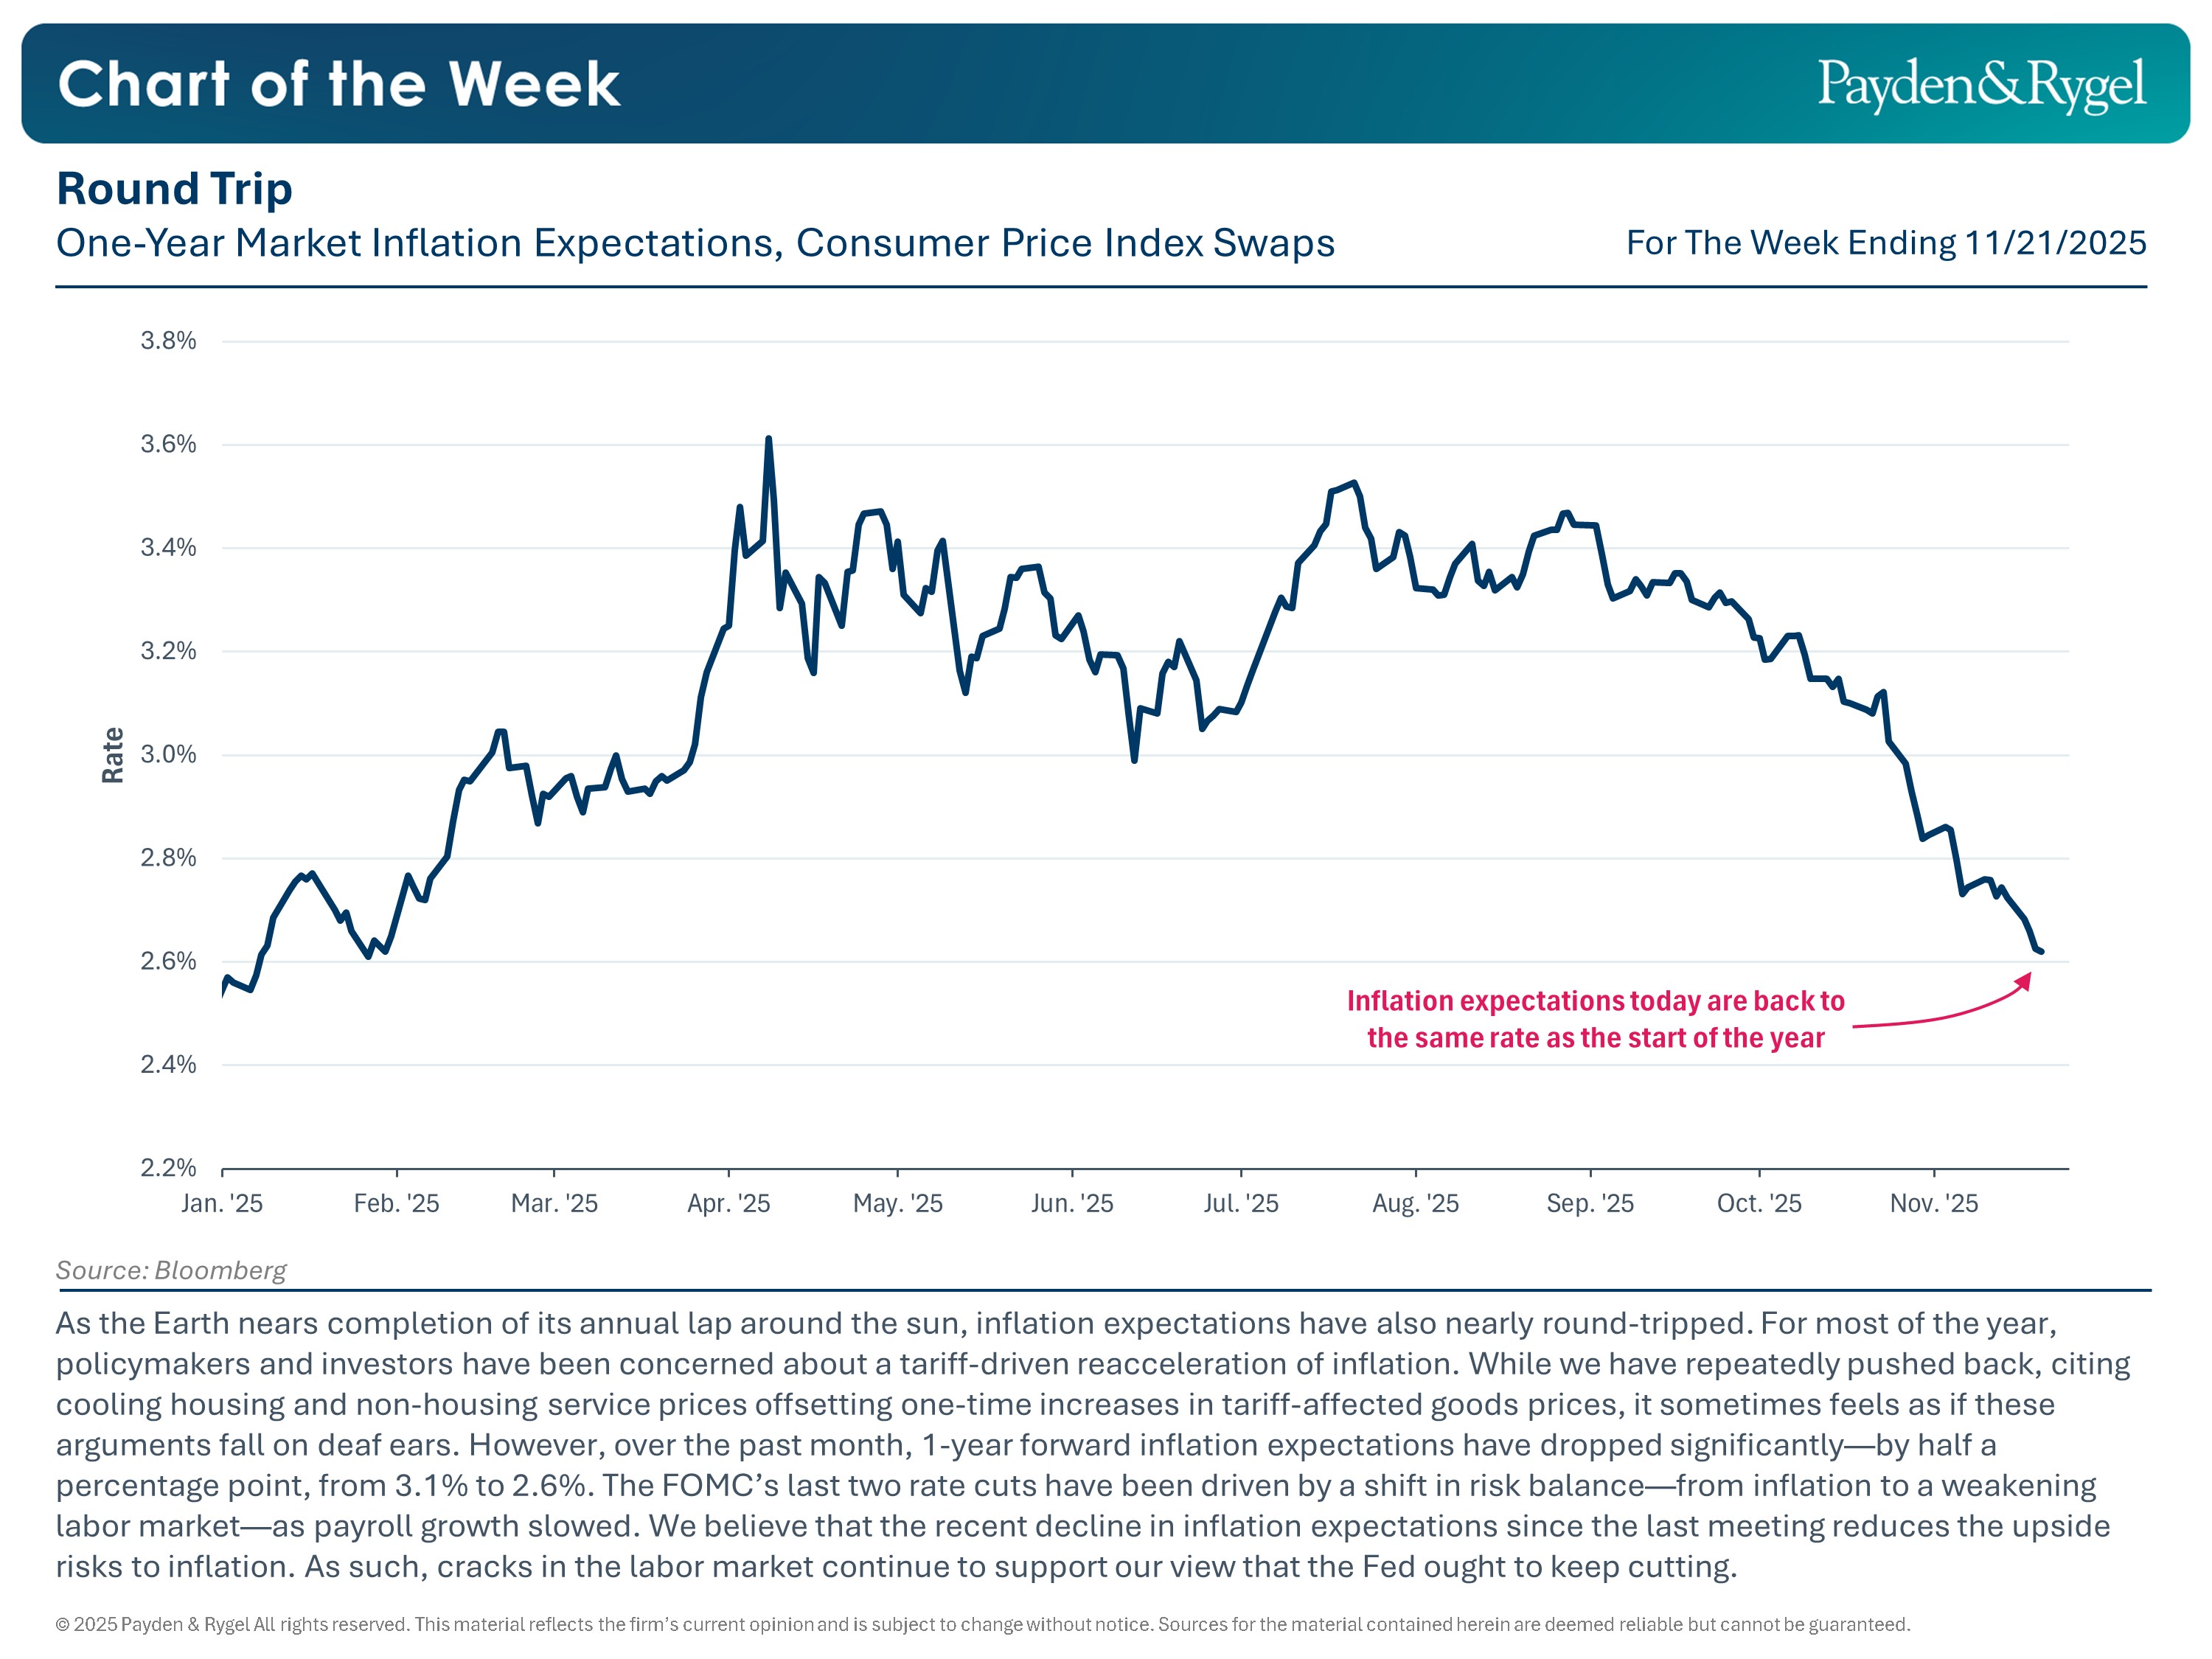
Core inflation, as measured by core PCE, has been near 3% for much of 2025. But excluding the impact of tariffs, core PCE inflation in August is already 2.4% year-over-year, much closer to the Fed’s 2% target. As a result, market inflation expectations have also returned to where they started at the beginning of the year.
In our view, tariffs represent a one-time shock to goods prices akin to a value-added tax. As tariff price pressures fade in 2026, and services continue to moderate to their long-run average or even slightly below if the labor market remains weak, it’s likely that core inflation can reach 2% in late 2026.
U.S. labor force growth is slowing, but the impact of immigration on wages needs to be considered alongside labor supply (the labor force) and labor demand (job openings).
For example, the sharp acceleration in wages during Covid-19 was driven by an eight million-person decrease in the U.S. labor force and a 7.5 million-person jump in job openings (or job demand) the following year (so a 15.5 million job-demand-to-supply gap!).
Today, labor demand has already fallen below labor supply. Going forward, even with immigration restrictions, the labor force may still grow, just at a much slower pace than in the last two years. More importantly, the demand for labor may be declining even faster with slowing job openings and a pickup in announced layoffs, keeping wages in check. What’s more, the AI boom may further depress labor demand, especially among younger workers. In fact, the youth unemployment rate reached a cycle high in Q2 2025.
The neutral rate has always been an ambiguous concept, hard to measure in real time. In general, though, the long-run nominal neutral rate is usually the sum of the real neutral rate, reflecting real economic growth, and the long-term average inflation rate. Over the last two decades, various economic models suggest that the U.S. real neutral rate was around 1% when trend GDP growth was 2%. Higher productivity will likely push up the trend growth and, in turn, the real neutral rate.
However, as discussed above, a lower long-term average inflation rate could offset some of the rise in the real neutral rate, keeping the nominal neutral rate around 3%.
That said, in the next 12 months, what the Fed needs to react to is changes in labor market conditions and inflation, rather than attempting to estimate any structural change in “neutral.” Moderating inflation and a weakening labor market make the case for lowering the policy rate first, especially given that the majority of policymakers still think the neutral rate is below today’s fed funds rate (see Figure 3). Once we are closer to neutral, then policymakers can reassess if the economy overheats or deteriorates further.
Effective Fed Funds Rate Versus Distribution Of Policymakers’ Neutral Rate Expectation*

*As of September 2025
An emerging narrative seeking to explain continued consumer spending despite a weaker labor market is that higher-income consumers are driving most of it, while spending by low-income households deteriorates. For the higher-income consumers, it’s the wealth effect (real estate and stocks) that is fueling the spending.
While it is true that higher-income consumers account for a larger share of consumer spending, this has been the case for decades, not a recent shift.
Further, the key driver of consumer spending is still wage growth, which is linked to employment growth.
For example, in a normal expansionary period, nominal personal income increases at an average annual rate of 4.4%, of which around 60% is attributable to wage growth. Similarly, nominal personal income has increased 5.1% over the last 12 months ending August 2025, and 58% of the year-over-year growth is attributable to employer compensation.
Meanwhile, 32% of income growth was from government transfer receipts, and only 7% from income receipts on assets, such as stock dividends and debt interest payments. If income from assets is driving spending, we have not yet seen the evidence in the data.
As a result, as long as the economy continues to add jobs and the unemployment rate remains low, real aggregate consumer income will increase, fueling expenditures (see Figure 4). If consumer spending were to falter, it would do so as job growth turns negative, rather than due to a change in asset values.
Real Personal Expenditures Versus Consumer Power*

*Employees on nonfarm payrolls*weekly hours worked*real hourly earnings
Further, if high-income investors are borrowing against their assets or selling their assets to spend, we are not seeing much evidence of it. Households are not selling their assets, as household financial assets continue to rise as a share of nominal GDP growth. Moreover, overall household debt as a share of household financial assets also remains near its cycle low, meaning that assets are still growing faster than the rate of borrowing (see Figure 5).
Total Household Debt As A Share Of Household Financial Assets

Finally, suppose households are using assets as collateral and taking out additional loans. In that case, we’d expect to see this reflected in increases in revolving home equity (home equity loans) and overall consumer credit. So far, neither has risen significantly as a share of household financial assets (see Figure 6).
Consumer Credit And Home Equity Revolving Loans As A Share Of Household Financial Assets

Indeed, tech-related spending has accounted for nearly 40% of private demand growth in the last four quarters. As a result, many investors worry that the AI boom will be a repeat of the “dot-com” bubble in the 1990s and will soon collapse. We are skeptical of such views.
First, the AI boom today differs significantly from the “dot-com” bubble. For example, AI adoption has been faster than any previous technology. Today, at least 54.6% of the U.S. working population uses AI chatbots regularly, compared with only 30.1% of U.S. households surfing the web in 1998. Further, there’s no overbuilding of data centers, yet. While a large amount of spending goes into building data centers, they run 24 hours a day, 365 days a year, while the demand for computing capacity continues to increase. Meanwhile, only 2.7% of the fiber optic lines laid out nationwide in the late 1990s were used.4
Second, current AI investment is being reflected in progress. Notable AI models’ performance has advanced quickly, and the new semiconductors used to train them are seeing a 30% annual increase in performance-per-dollar (see Figure 7).
Inflation-Adjusted Performance Per Dollar Of Select NVIDIA Datacenter GPUs*

*Graphics processing units (GPUs)
Third, perhaps the decision to extend the usable life span of GPUs in hyperscalers’ balance sheets is not entirely unfounded. In fact, the average “life span” of a new chip design has increased slightly from three to four years to exceed four years in some cases! (see Figure 8). Better designs may continue to improve the performance and lifespan of GPUs.
Leading AI Chip Designs From Release Date To Last Use Date

Fourth, the investment momentum may continue. The projected capex for 2026 is on par with the 2025 pace before slowing in 2027 and 2028 (see Figure 9).
Hyperscaler Capex Growth, Actual And Consensus Forecast

Finally, recent concerns that hyperscalers are out of cash and tapping the debt market miss the big picture. Indeed, investment-grade bond market supply and loan supply from big tech names totaled over $239 billion in 2025, whereas supply in 2024 was only around $119 billion.5 While we agree that debt-fueled growth tends to create more vulnerability in company cash flows, debt has been a financing source for corporations for a long time—that’s why there’s a whole bond market for it!
Since the pandemic, the U.S. bond market has grown by 24%. Today, public and private corporate debt outstanding totals $8.7 trillion—an additional $120 billion in investment-grade issuance would represent only a 1% increase.6
Another popular narrative is that consumer spending and inflation could accelerate due to additional OBBBA tax refunds of $517.3 billion, a $158 billion increase from 2025.
However, the actual impact of the OBBBA on the economy needs to be considered in terms of the marginal change and put in perspective with past stimulus and the size of the economy.
Specifically, government transfers to consumers in 2025 totaled roughly $4.6 trillion—additional tax refunds of $158 billion in one month would be a one-time 3% boost. Meanwhile, the fiscal stimulus after the pandemic, which actually fanned inflation, boosted consumer spending by more than 50%.
The Hutchins Center’s Fiscal Impact Measure provides a precise estimate of the net impact of various fiscal policies. Excluding government shutdown impacts that eventually net to zero in the next few quarters, the total fiscal impact will only boost real GDP by 0.5 percentage points in Q1 2026, a magnitude similar to the government’s contributions in 2024 (see Figure 10). The OBBBA by itself will contribute to a 0.8 percentage point increase in real GDP, but is offset by the drag from tariff-related uncertainties. Finally, the total fiscal boost will average only 0.23 percentage points per quarter in 2026, a small contribution to overall growth.
Hutchin's Center Government Contribution To Quarterly Real GDP Growth

Some investors have concluded that 2% growth and 2% inflation will serve as a floor for the 10-year Treasury yield at today’s levels of approximately 4%, if not higher.
The counterargument is simple: 10-year yields were around 2% to 3% in the late 2010s, even though GDP growth was on an upward trend and inflation was near target.
How so? The two primary drivers of longer-term yields are inflation breakeven and market expectations of the fed funds rate, and the weights are not one-to-one.
As a result, our case for the 10-year Treasury yield in the 3.00% to 3.50% range is twofold.
First, in 2025, 10-year Treasury yields have fallen by 60 basis points year-to-date as markets began to expect more rate cuts, even though inflation expectations had picked up. Additional rate cuts in 2026 will further drive yields lower.
Second, and perhaps more importantly, inflation breakeven is the most significant drivers of the 10-year yield. If inflation surprises markets and moderates toward the Fed’s 2% target in 2026, we expect inflation breakeven to drive most of the yield decline.
The steepening curve view has played out nicely in 2025, but perhaps for reasons beyond political concerns. Instead, rate-cut expectations pushed 2-year Treasury yields down by 70 basis points. And 10-year yields fell about 60 basis points as elevated inflation expectations and term premium offset some of the rate-cut impact.
Going forward, though, our hunch is that the 2s10s curve may remain flat, similar to today’s 2s10s slope of 40 basis points. As mentioned above, in 2026, 10-year Treasury yields have more room to fall as inflation moderates, but there’s limited scope for the 2-year yield to fall since the majority of Fed rate cuts are already priced in.
And, there is a precedent for a flat yield curve as the economy expands, as seen during the productivity boom of the late 1990s. From 1995 to 1999, the spread between 2s and 10s and between 2s and 5s remained within the 0 to 50 basis points range. Above-trend GDP growth kept short-term rates modestly higher, while sub-2% core inflation exerted downward pressure on longer-term yields. A similar situation could unfold in 2026 (see Figure 11).
Finally, Fed independence concerns are more hype than reality. The President will have the chance to appoint at least one new Fed Board member in 2026 (two, if Jerome Powell resigns from the Board before his term as Governor ends in 2028) and a new Fed Chair (Powell’s Fed Chair role ends in May 2026). However, the FOMC is a majority-rule committee, and one or two changes in its composition may do little to alter policy outcomes. In fact, the key driver of monetary policy is the economic data. The Fed policy rate tends to lag the economic data.
10-Year Minus 2-Year Treasury Note Yield For The 1990s Versus 2020s

Indeed, the Treasury Department announced that it will increase the share of T-Bills in debt issuance. At the same time, the Treasury General Account (TGA), the “checking account” of the U.S. government, has also increased. Is the U.S. facing funding stress?
Far from it.
The recent rise in the Treasury General Account mainly reflects the government shutdown, which halted federal paychecks and led to a buildup of funds, rather than high demand for short-term debt.
Further, recall that the U.S. Treasury's goal is to manage the country's debt at the lowest possible cost to taxpayers. As a result, with the Fed expected to cut rates by 100 basis points and today’s longer-term yields still elevated, it makes sense for the Treasury to ramp up T-bill issuance rather than lock in higher interest costs with coupon issuance. Outside of recessions, the share of outstanding T-Bills tends to decrease when the 10-year yield is low and rise when the 10-year yield is high (see Figure 12).
T-Bills Share Of Total Treasuries Outstanding Versus 10-Year Treasury Yield

Narratives that link dollar strength to trade flows, fiscal concerns, secular shifts, valuations, hedge ratios, political schemes, and productivity reflect a fundamental misconception of the key drivers of the U.S. dollar exchange rate.
Differences in rates and growth expectations between the U.S. and other major economies are the key driver of the dollar's exchange rate, accounting for 87% of USD variation since 2021. More specifically, since 1998, when the USD/EUR sold off by 5% or more, either the U.S. rate differential with European rates was decreasing, or U.S. growth expectations were underperforming those of Europe.
In recessions, the U.S. dollar generally appreciates by 5% to 12%, as it acts as a safe haven for domestic and foreign investors. In the last “tech-driven” recession, i.e., the 2001 recession, the dollar still appreciated 2.4%.
The only two exceptions were the 1980s and 1990s recessions. In the 1980s, the recession was stagflationary and short-lived, only to be followed by a double-dip recession in which the dollar strengthened by 12%. Meanwhile, during the 1990s recession, the dollar temporarily dipped because the European downturn did not begin until the U.S. recession had ended, so the Fed was cutting rates while Germany kept rates elevated.
Now, some investors might ask: what if the U.S. falls into a tech-driven recession while the rest of the world remains fine? Well, the rest of the world rarely escapes unscathed when U.S. growth falters. Take the case of Europe: out of the 60+ years since 1960, when the U.S. was in a recession, the euro area was in a recession 70% of the time, and in the remaining 30% of the time, the euro area’s recession began after the U.S. recession ended. There has been only one exception: the 1960-1961 recession, when the Fed tightened rates to influence gold outflows, which eventually led to a recession, while Europe continued to expand.
By the way, even if the U.S. stock market leads a sell-off, the European market could see a similar drawdown. Historically, European drawdowns have been more severe (see Figure 13).
Maximum Drawdown From Peak To Trough*, U.S. S&P 500 Versus Europe STOXX

*Europe STOXX drawdown is measured using the peak of U.S. S&P 500 to the trough of Europe STOXX
We heard the narrative that increased government spending on defense and infrastructure will boost German growth for most of 2025. We were skeptical of such optimism.
So far, such a narrative has failed to translate into actual GDP growth. Germany's real GDP growth is still zero in the first three quarters of 2025.
And the private sector (consumer spending and business investment) will always be the true driver of real growth. A surge in government spending usually will not sustain private demand growth unless it translates into productivity growth, especially in the short run.
Additionally, bullish investors argue that if the ECB were to keep monetary policy more accommodative, that should stimulate growth. But the ECB is already at, or even slightly below, neutral today; a further rate reduction is unlikely to boost economic growth.
Further, we’ve discussed in a recent Point of View article that many structural issues set European productivity (hence growth) apart from the U.S., such as higher energy costs, stagnant private research and development spending, and a lack of funding for startups. As a result, the U.S. has outperformed Europe over the last two decades in new firm creation, productivity growth, capital stock, and stock market returns. Europe’s structural barriers will require more policy changes and take longer to reform than a one-country increase in government spending focused on the defense sector.
Not really. U.S. 10-year Treasury yields tend to lead DM yields (see Figure 14).
Sure, both Japanese and U.S. 10-year government yields increased in unison in the first half of the year, but so did Germany's and the UK's. Moreover, the trend has diverged recently (see Figure 15).
As mentioned above, the next move by the Fed is likely to be a cut, while the Bank of Japan is still looking to hike rates, as underlying inflation remains near 2%. So, divergence between U.S. and Japan rates will likely continue in 2026.
U.S. Versus Global 10-Year Government Bond Yield

*Includes Germany, France, Canada, Sweden, Norway, Switzerland, Australia, New Zealand, weighted by GDP PPP weighted in USD, constant prices
Year-To-Date Change In 30-Year Government Bond Yields

If you’re using any one of the above narratives as a rationale for portfolio positioning, buyer beware!
In Being Wrong, Kathryn Schulz reminds readers that “the whole reason it’s possible to be wrong is that, while it is happening, you are oblivious to it. When you are simply going about your business in a state you will later decide was delusional, you have no idea of it whatever. You are like the coyote in the Road Runner cartoons, after he has gone off the cliff but before he has looked down. Literally in his case and figuratively in yours, you are already in trouble when you feel like you’re on solid ground. So I should revise myself: it does feel like something to be wrong. It feels like being right.”7
We hope to have cast at least some doubt on your favorite narrative and made you think that maybe, just maybe, you’re wrong even though you feel right.
Given our arguments above, chipping away at the prevailing narratives, we find it plausible that the U.S. economy will continue to grow in the near term, powered by tech-driven investment, while job growth could remain sluggish with the unemployment rate drifting higher. As a result, inflation likely moderates, the Fed keeps cutting its policy rate, and Treasury yields fall in sympathy with lower overnight rates and softer inflation. At the same time, the dollar could remain rangebound or even strengthen as U.S. growth outpaces Europe.
Happy Holidays and Best of Luck In 2026!
The Payden Economics Team
Endnote
1. Using real GDP prints as of February 2004 to reflect the data policymakers are viewing in real time. GDP gets revised again annually and every 5 years, so today’s GDP print in 2002-2003 will be slightly different.
2. Federal Reserve Press Release. (June 25, 2003). FRB: Press Release -- FOMC statement -- June 25, 2003
3. See footnote 1.
4. Dreazen, Y. J. (2002, September 26). Wildly Optimistic Data Drove Telecoms to Build Fiber Glut. The Wall Street Journal. https://www.wsj.com/articles/SB1032982764442483713.
5. Martin R. (November 24, 2025). Big Tech’s AI Debt Wave Threatening To Swamp Credit Markets. Bloomberg. https://blinks.bloomberg.com/news/stories/T68DZLT9NJLU
6. Bank for International Settlements. Debt Securities Statistics. Debt securities statistics - data | BIS Data Portal
7. Schulz, Kathryn. Being Wrong: Adventures in the Margin of Error. Ecco, 2010.
© 2025 Payden & Rygel All rights Reserved. This material reflects the firm’s current opinion and is subject to change without notice. Sources for the material contained herein are deemed reliable but cannot be guaranteed.
LOS ANGELES | BOSTON | LONDON | MILAN