
Hold Your Horses
Surprisingly weak July nonfarm payroll growth prompted the bond market to take rate hikes off the table. Is the July jobs dud really a game-changer?
(Published August 7, 2026)
--
The July employment situation report released Friday morning showed that the U.S. economy shed 23k jobs during the month. Worse, the previous two months of job growth were revised down by 102k, dragging the three-month average of job growth to just 20k per month.
The bond market now implies only a 42% chance of a hike in September, compared to over 60% at the start of the week.
Is the July jobs report really a game-changer for the rate hike story?
Not so fast. Friday’s report contains more nuance than the headlines suggest, and we’d advise investors to examine the complexity rather than shift views based on a single data point.
Summer Slump?
First, the moderation in job growth could be related to seasonal trends or noise.
After all, over the last two years, job growth in the first half of the year has run higher than in the second half (see Figure 1). Monthly revisions, too, have consistently come in negative, especially during the summer (see Figure 2).
Average Nonfarm Payroll Job Growth In The First And Second Half Of Past Years

Average 2-Month Net Revisions In Nonfarm Payroll Employment

*Data available through July 2026
The July job losses were concentrated in two particular and related sectors, local government and education, which feels related to summer vacation. On the bright side, the breadth of job growth was still pretty extensive in July: seven out of the 10 private sectors added jobs, compared to only four last month and only two or three in the latter half of 2025 (see Figure 3).
Share Of Private Sectors Adding Jobs Each Month

Breakeven Bargain: We Don’t Need As Many Jobs Each Month
Second, excluding the volatility in government hiring, the private sector added jobs at an average pace of 40k per month in the last three months, a slowdown from the beginning of the year but still a modest pace.
Zooming out, the “breakeven pace” of job growth in 2026 is likely closer to ~10k per month, making the current 40k per month pace more than enough to keep a cap on the unemployment rate.
Participation Points: The Participation Slump Is Structural
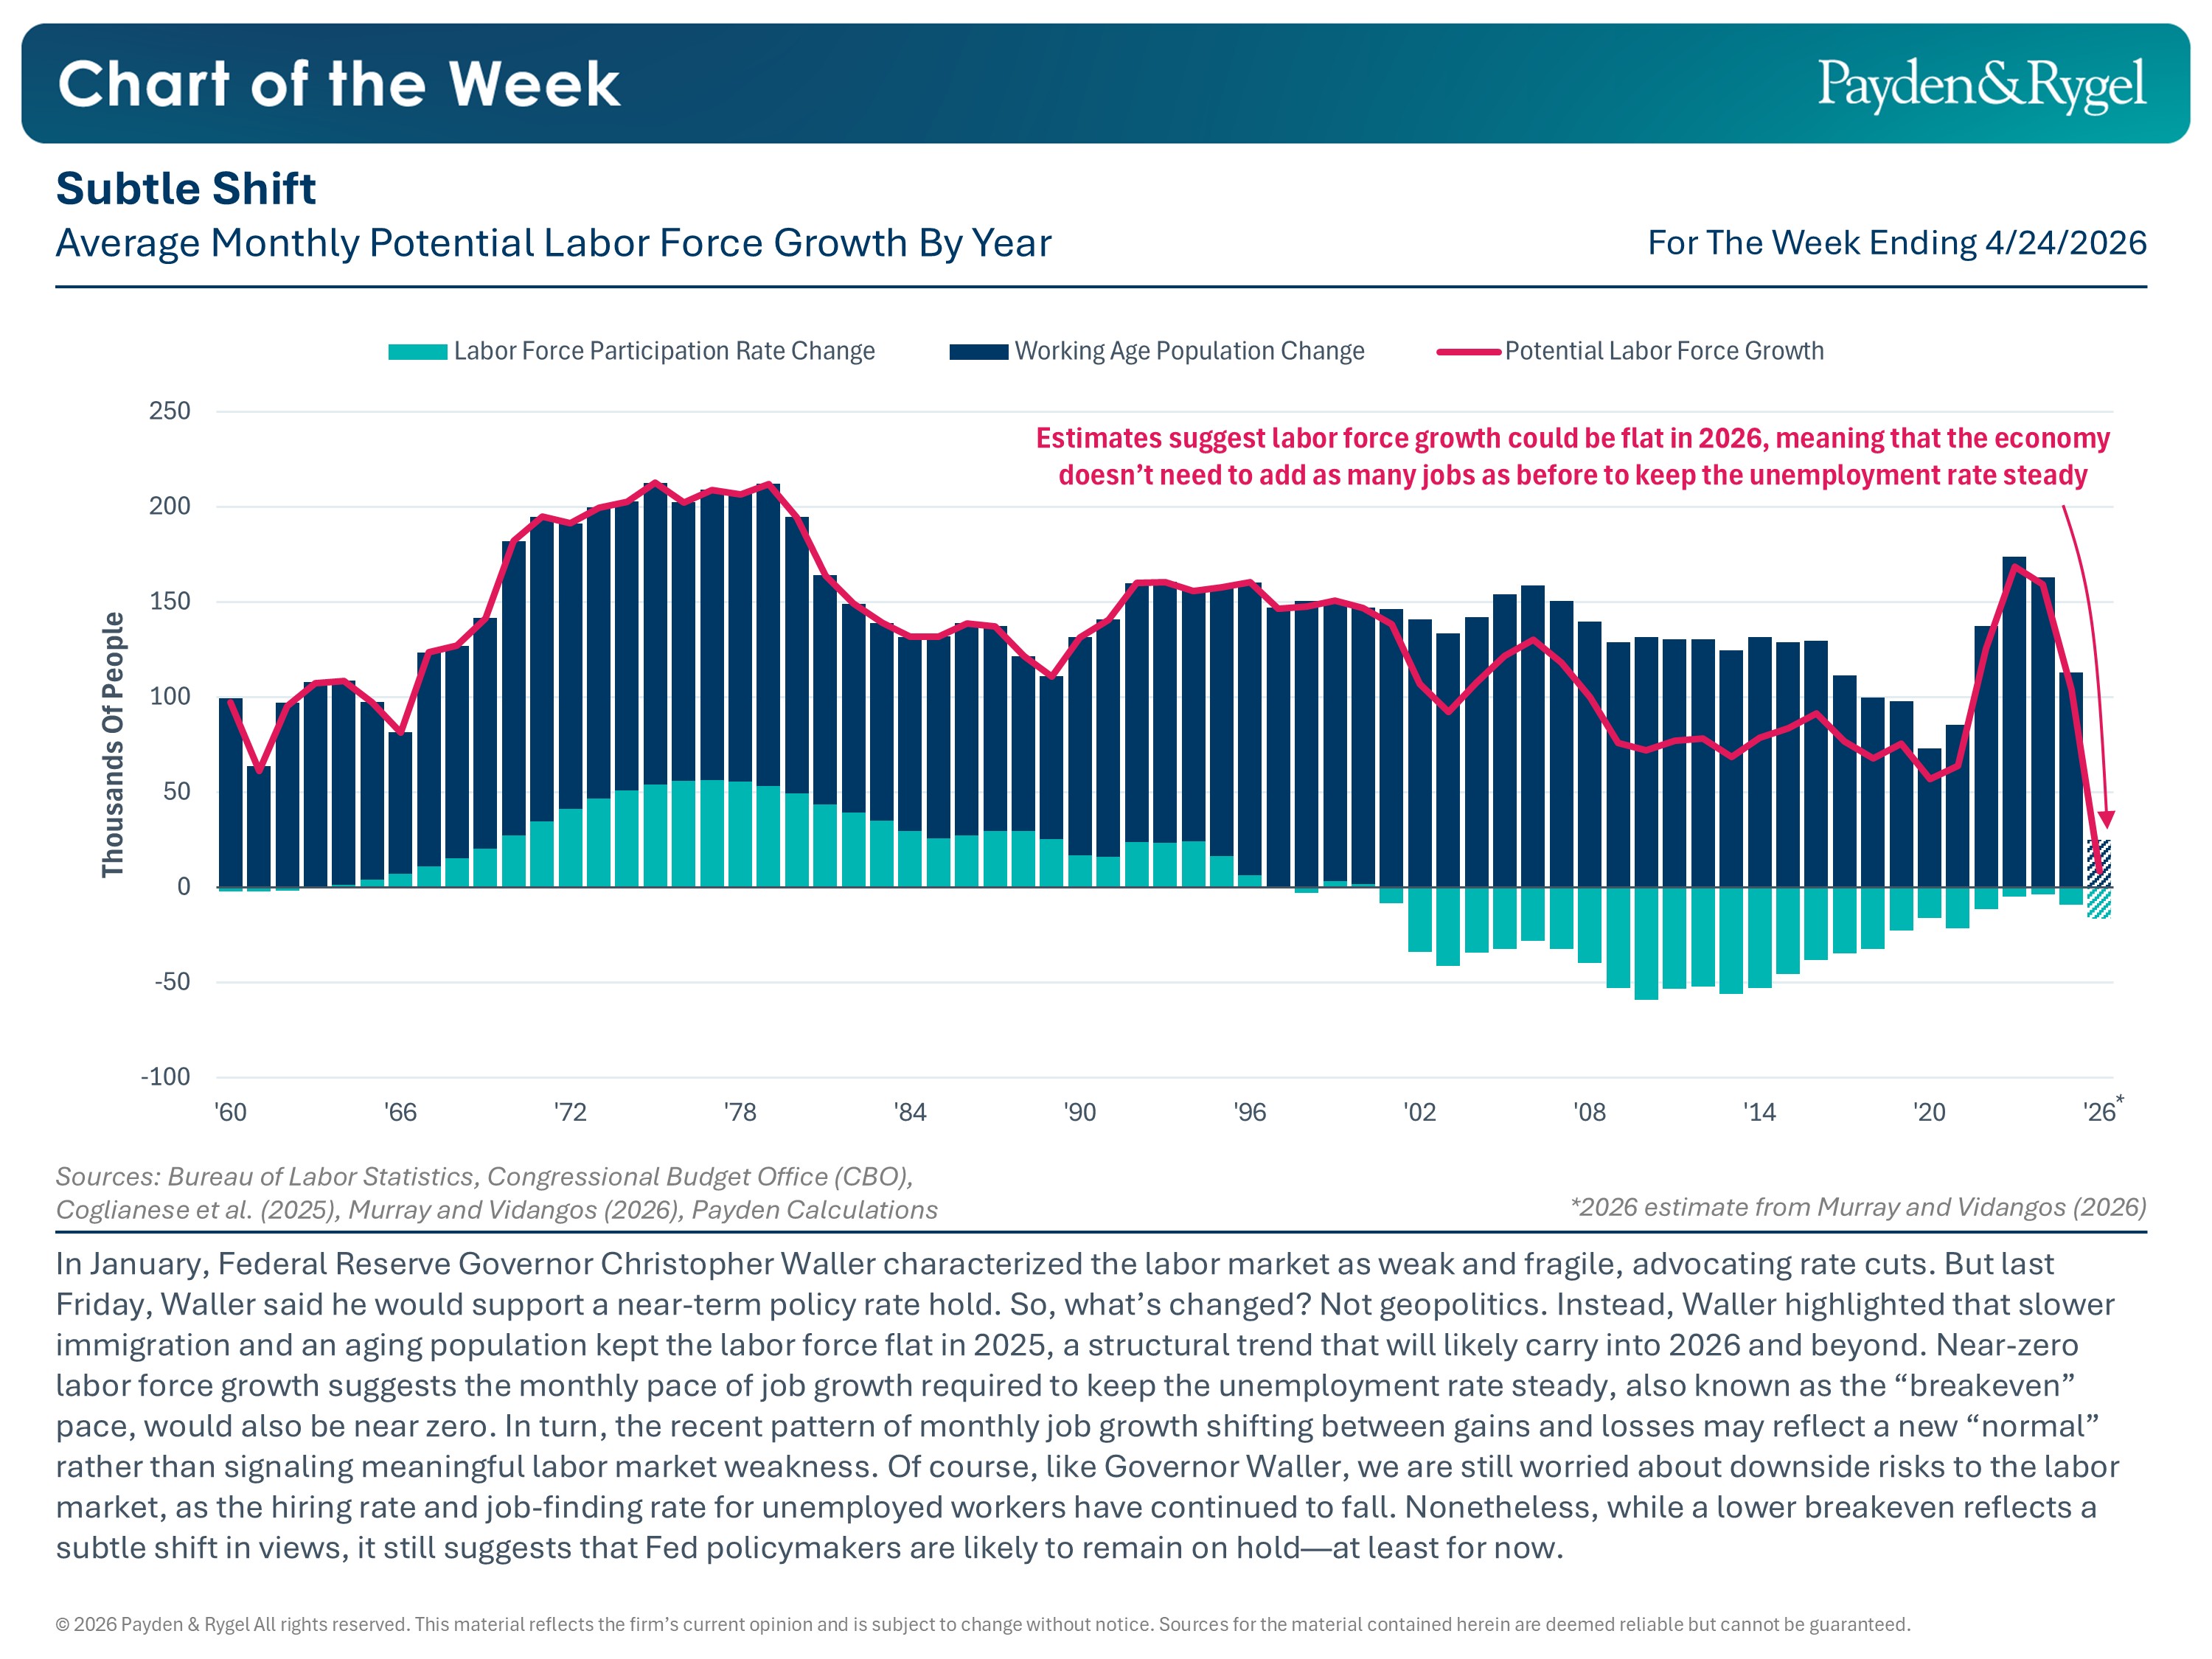
Third, the labor force participation rate fell to 61.4%, the lowest rate since March 2021. In turn, the overall labor force contracted by 264k in July, dragging the unemployment rate down to 4.1% despite negative headline job growth (i.e., more people left the labor force than became unemployed during the month).
Instead of marking a cyclical slump, the decline in labor force participation is part of a longer-term structural trend. In fact, the contraction in the labor force in July was more concentrated among younger and older workers. We already know that the youth unemployment rate is under pressure from the rise of remote work and AI, while an aging population will see more retirees than new joiners.
Meanwhile, the total labor force in the 25-to-34 cohort has actually increased in July, suggesting that June's sharp drop in labor force was likely a “fluke” (see Figure 4).
Change In Total Labor Force In 2026 By Age Cohort

And zooming out further, the core working-age employment-to-population ratio ticked back up in July after a hiccup in June but remains higher than the majority of the time in the previous expansion (see Figure 5).
Prime Age (25-54 Years) Employment To Population Ratio

Flowing Facts: Job Jumping Is Still Happening
Fourth, when we examine the flows of workers in and out of employment, it is becoming harder for unemployed workers and workers outside the labor force to find a job. However, job turnover of employed workers is still strong (see Figure 6).
The share of workers who were unemployed in June but were able to find jobs in July is much lower today than it was in the last few years and in the late 2010s.
For workers who were not actively looking for jobs in the previous month, their job-finding rate has been dipping below the pre-Covid long-run average.
Meanwhile, for workers hopping from one employer to the other, the employment outlook looks solid (see Figure 6 again).
In other words, we are still in a low-fire, low-hire labor market, a fragile but balanced equilibrium.
Flows Into Employment From Unemployed, Outside The Labor Force, And Between Employers

Earnings Erased: Reaccelerating Inflation Is Not A Labor Market Threat
Fifth, given that the unemployment rate today is the lowest it has been in over a year and labor supply is constrained, is the labor market becoming a source of inflationary pressures?
No. Average hourly earnings, although a volatile measure, cooled to their slowest year-over-year pace since Covid-19. Last week, we also received the Fed policymaker’s preferred wage measure, the Employment Cost Index (ECI) through Q2, which barely showed moderation. But with productivity growth still solid, unit labor costs, which capture the cost of labor for businesses after accounting for productivity gains, have continued to moderate over the last four quarters (see Figure 7).
Wage Growth, Productivity Growth, And Unit Labor Costs*

*Unit Labor Costs measure the cost of labor input required to produce one unit of output
The bottom line is that the U.S. labor market exhibits a unique set of factors: layoffs are low, but so is hiring activity. If you lose your job, it’s more difficult to get hired. While retirement-aged workers continue to leave, the core working-age population remains employed, and overall job growth exceeds the number of jobs needed to match a slowly expanding labor force, keeping the unemployment rate low. In aggregate, the labor market is neither overheating nor collapsing.
But what does it change for the Fed?
For a Fed that has missed its inflation target for 5 years running, not much. That’s because the characterization of the labor market we detailed above has been true for much of the year. If we assess the appropriate policy rate setting using the Taylor Rule, an unemployment rate of 4.1% in July and core inflation at 3.3% suggests that the appropriate policy rate is still 50-75 basis points higher than the current setting. In sum, we continue to expect the Fed to have a hiking bias.
The negative NFP print might give a few policymakers reason to wait a little longer, but we will see one more job report, two more CPI prints, and another PCE inflation print ahead of the September FOMC meeting. If inflation prints above 0.3% month-over-month, and the August jobs report bounces back from weak summer hiring trends, rate hikes might be right back on the table.
Holding on to our horses before September,
Payden Economics Team
© 2026 Payden & Rygel. All rights reserved.
This material reflects the firm’s current opinion and is subject to change without notice. Sources for the material contained herein are deemed reliable but cannot be guaranteed. This material is for illustrative purposes only and does not constitute investment advice or an offer to sell or buy any security. Past performance is no guarantee of future results.
This material has been approved by Payden & Rygel Global Limited which is authorised and regulated by the Financial Conduct Authority and by Payden Global SIM S.p.A. which is authorised and regulated by CONSOB.
LOS ANGELES | BOSTON | LONDON | MILAN